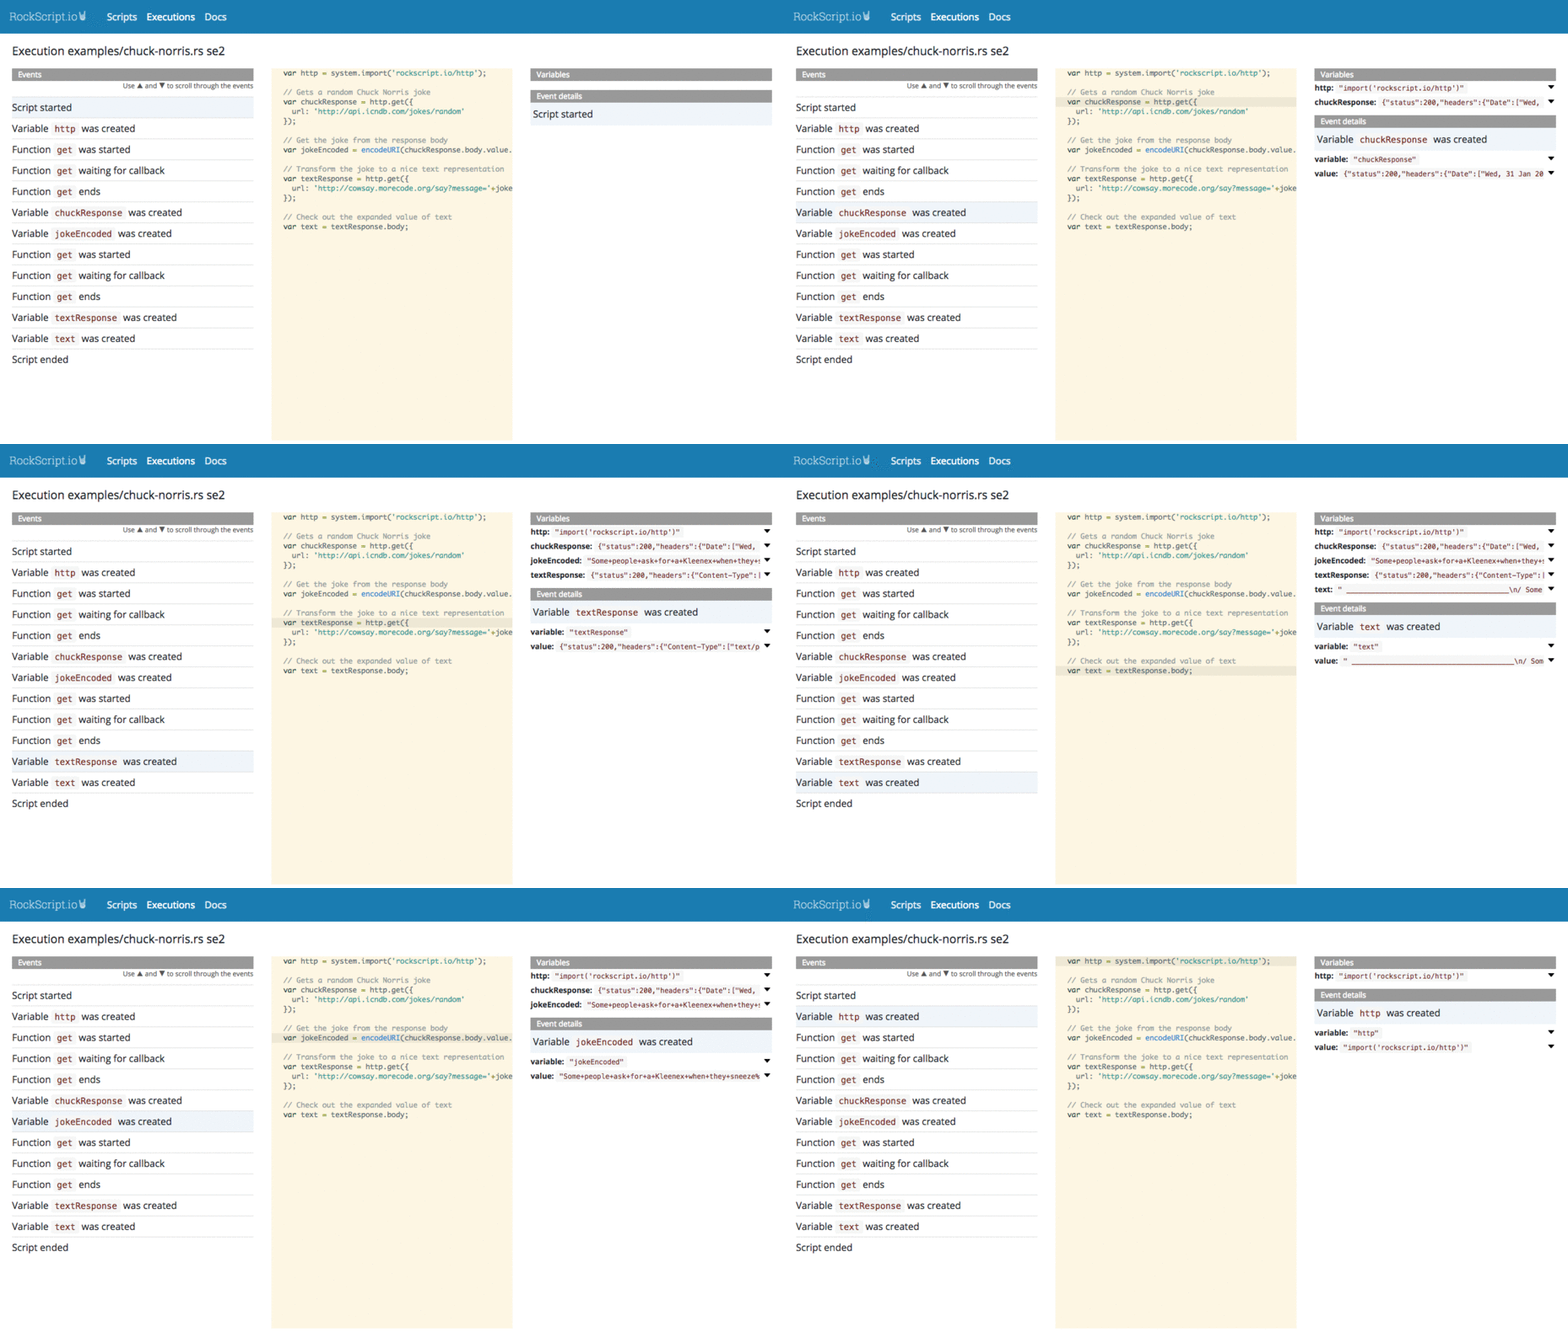
The script execution inspector
Observability is a hot topic for cloud infrastructure right now and that’s not surprising.
Digging into traditional enterprise system already was a pain, even when we had log files.
The log files contained logs of multiple threads/requests interlaced.
The pain only gets worse on cloud infrastructures like eg Kubernetes clusters: systems get spawned and removed dynamically. It’s hard to keep track of the actual systems involved. And those microservices collaborate to get things done. So it’s even harder to track down those relations.
Distributed logging is one answer. But instead of sifting through tons of logs imagine that you can have a debugger experience on top of your cloud logic. That’s exactly what Rockscript offers as an alternative. A script in RockScript performs that coordination logic between the systems. It provides resilience and makes services eventual consistent. The runtime state of script executions are persisted. Therefore that runtime state can be visualized for ongoing script executions as well as for completed executions.
RockScript executions are stored with event sourcing. So you can even do time travel. This means that you can step through the events, see the related position in the script and the variable values at that time. Both step forward and step backwards are possible.

The right column shows the events that are stored for the script execution. This includes variable changes, service function invocation events and so on.
The middle column shows the script and the line that corresponds to the selected event is highlighted.
The right column shows the variable values at the time of the selected event as wel as the details of the event.
The script execution inspector is free (but not open source).
Download the script execution inspector (link immediately available after a 5-field contact form)
You’re scrolling through the events in less then a minute.
For more info on product vs open source, see the products page
